
This article will be very useful for people who work on excel and create a lot of reports and wants to create interactive excel graph. Often your clients or boss asks for details on a graph and then you have to go back and make changes and appear in front of them just to be asked for another change.
Story Behind Interactive Excel Graph
Very recently a client of mine was asking me to prepare few reports and every time I prepared something, she was asking for some other and it was taking a lot of time. So basically I was trying to find a solution to this and I came across this interactive excel graph which can present data on multiple levels and as you change your parameters or range, the graph will change simultaneously. The fun part is you don’t have to go back to your data and make changes there, you can make those changes right in the graph.
Process
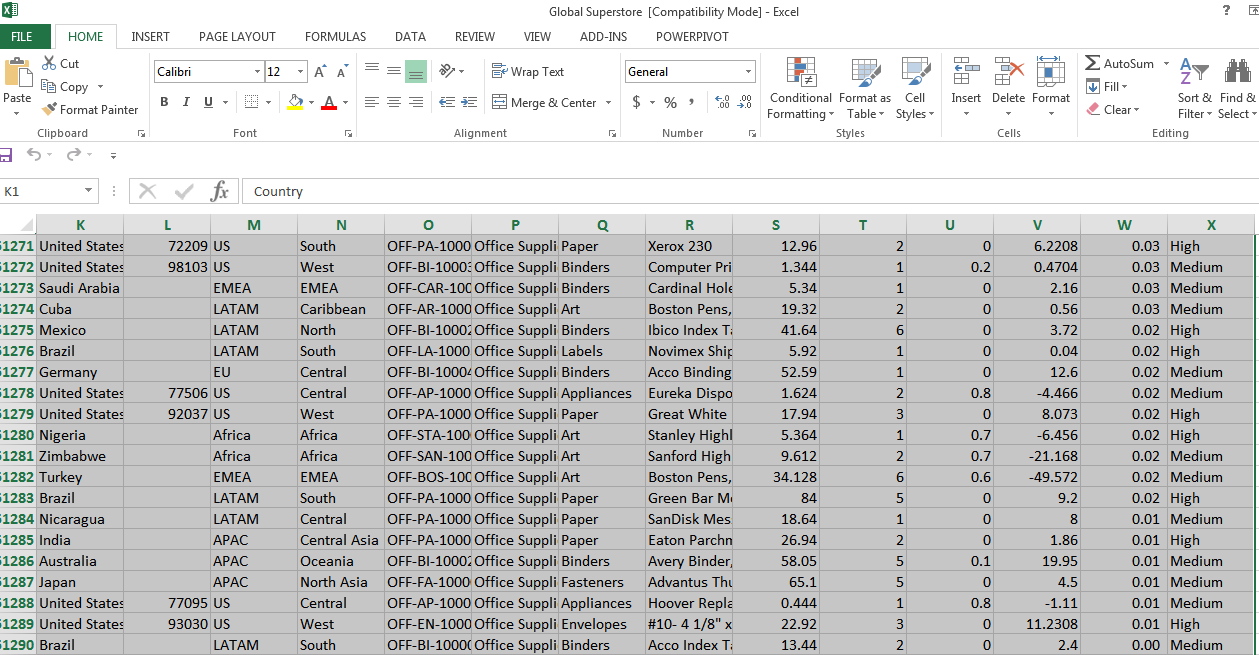
- Select your data set,

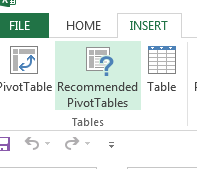
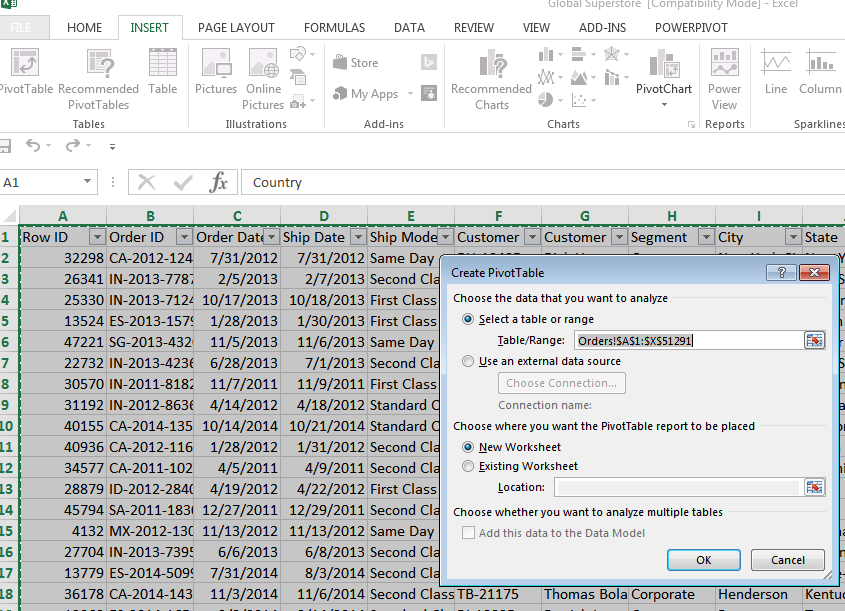
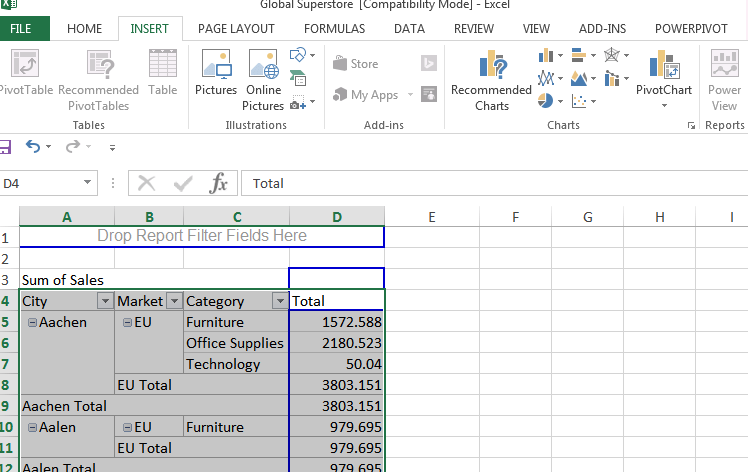
- Go to Insert tab

- Click on Pivot table

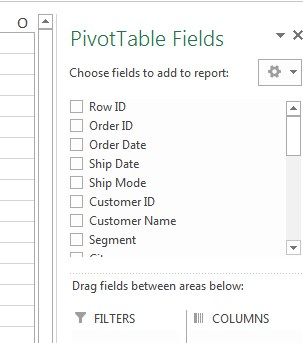
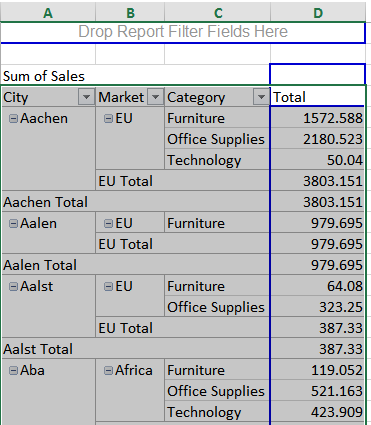
- You will get a pivot table like this. Now select parameters that you want to show in your graph

- You should get a pivot table like this. Now select this pivot table

- Go to insert tab and choose the graph you prefer. I have chosen column graph here

- You should get a graph like this

- But wait, the catch is here. At the left bottom side of the graph, do you see few tabs? Yes, these are your parameters of your graph which you can adjust right there. For example I have changed the parameter Category here and I have only taken Office supplies and the graph responds to that automatically


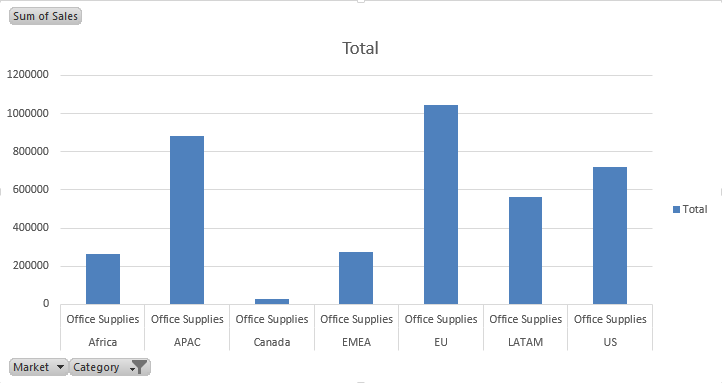
This is pretty fun. This tabs works like filters and you can filter out anything you want right there in the graph and there’s no need to come back to your data. So if you boss asks to show graph for a particular month and for a particular region and only sales number, you have a solution, your interactive excel graph.
Hope this helps.